NIR Grain Identification
NIR Grain Identification
Separating the wheat from the chaff with SIMCA
N ear-infrared (NIR) spectroscopy is routinely used to analyze grain identity and grain quality in agricultural production, and at various stages of processing. To work in these environments it must be rapid, consistent, capable of delivering robust answers, and preferably compact. To demonstrate the suitability of our WP NIR I and OEM spectrometers for these types of applications, we measured the NIR diffuse reflectance spectra of a dozen grain types, performing PCA, and applying SIMCA as a simple classification method for grain identification. Not only could they separate the wheat from the chaff, but they did so with great confidence.
Amazing Grains: Analysis with NIR
Grains are a staple food for the growing world population. Given the endless variety of grains from around the world available in today’s market, grain identification is no longer trivial for
non-experts. The variability in size and shape for similarly most sophisticated machine vision algorithms. NIR spectroscopy builds on that intelligence by providing information about chemical
composition, probing the grains’ moisture, protein, oil, and other parameters non-destructively and without any sample preparation.
As a result, NIR has become a go-to method for grain identification and quality control in the food industry, with applications from field to finished product. NIR’s ability to penetrate deeper into samples than visible light makes it ideal for diffuse reflectance, a very simple, non-contact sampling technique for material analysis. It can measure a single grain, or a moving stream.
For our diffuse reflection measurements, we compared both our benchtop and OEM models to truly put our ‘OEM by design’ philosophy to the test: to speed your time to market, we use the same robust, thermally stable, and highly consistent optical bench and electronics in our standard off-the-shelf products as in our drop-in OEM modules. This allows you to perform R&D or method development with our benchtop models, then rapidly migrate to our more streamlined OEM modules for your prototyping and production, with no loss of performance.
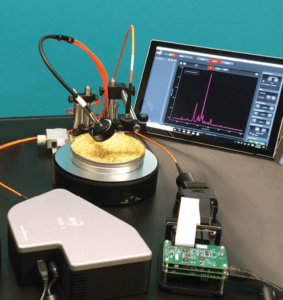
The grains chosen included conventional rice, oats, and quinoa, as well as old world grains like amaranth, wheat berry, buckwheat, and barley. For interest, we included two processed grain products derived from these grains – Cheerios™ and instant oats – to see how they compared against their grains of origin. A dozen grain types in total were measured – each piled 2 cm deep in a metal dish and smoothed to establish a constant sampling distance. A ThorLabs halogen light source was used for illumination, routed to the sample by a 600 μm fiber held at fixed distance of about 5 cm so as to probe a broad cross-section of grains. A bifurcated fiber sampled the diffuse reflection for detection by the WP NIR I and WP NIR OEM spectrometers, both of which covered 900 nm to 1700 nm with 5 nm resolution. The sample holder dish was placed on a rotating stage, and 20 measurements of 100-150 ms each were collected for each grain type during rotation to yield 20 unique views or ‘samples’. A fresh reference spectrum was taken before each new type of grain sample, using a white, lightly sanded Teflon disc as a diffuse reference standard. A final reference spectrum was recorded after all samples to check for spectrometer or light source drift.
Seeing in Broad Strokes
Plotting all spectra for each of the twelve grains, we see that the variation between the spectra recorded for the same sample depends strongly on the grain size. The two most consistent spectra were recorded for the smallest grains, Quinoa (QU) and Amaranth (AG). The off-the-shelf and OEM spectrometers appear to yield very consistent spectra, but as any chemometrician can tell you, the difference is in the details.

To examine this more closely, we scaled each spectrum using the standard normal variate (SNV) approach. This helps to account for experimental variations, such as sample to probe distance. In the SNV approach, one determines the mean and standard deviation across all wavelengths, subtracts this mean and divides by the standard deviation. This pre-processing removes some of the variation between spectra for the same grain type to make the groups more distinct, and prepares the data for further analysis. As we are interested in the difference between the groups, we then mean-center the spectra, i.e., subtract the overall mean scaled spectrum from every scaled spectrum. This brings out the unique spectral features of each grain type, particularly when we focus on the central portion of the spectra, from 950 nm to 1650 nm.
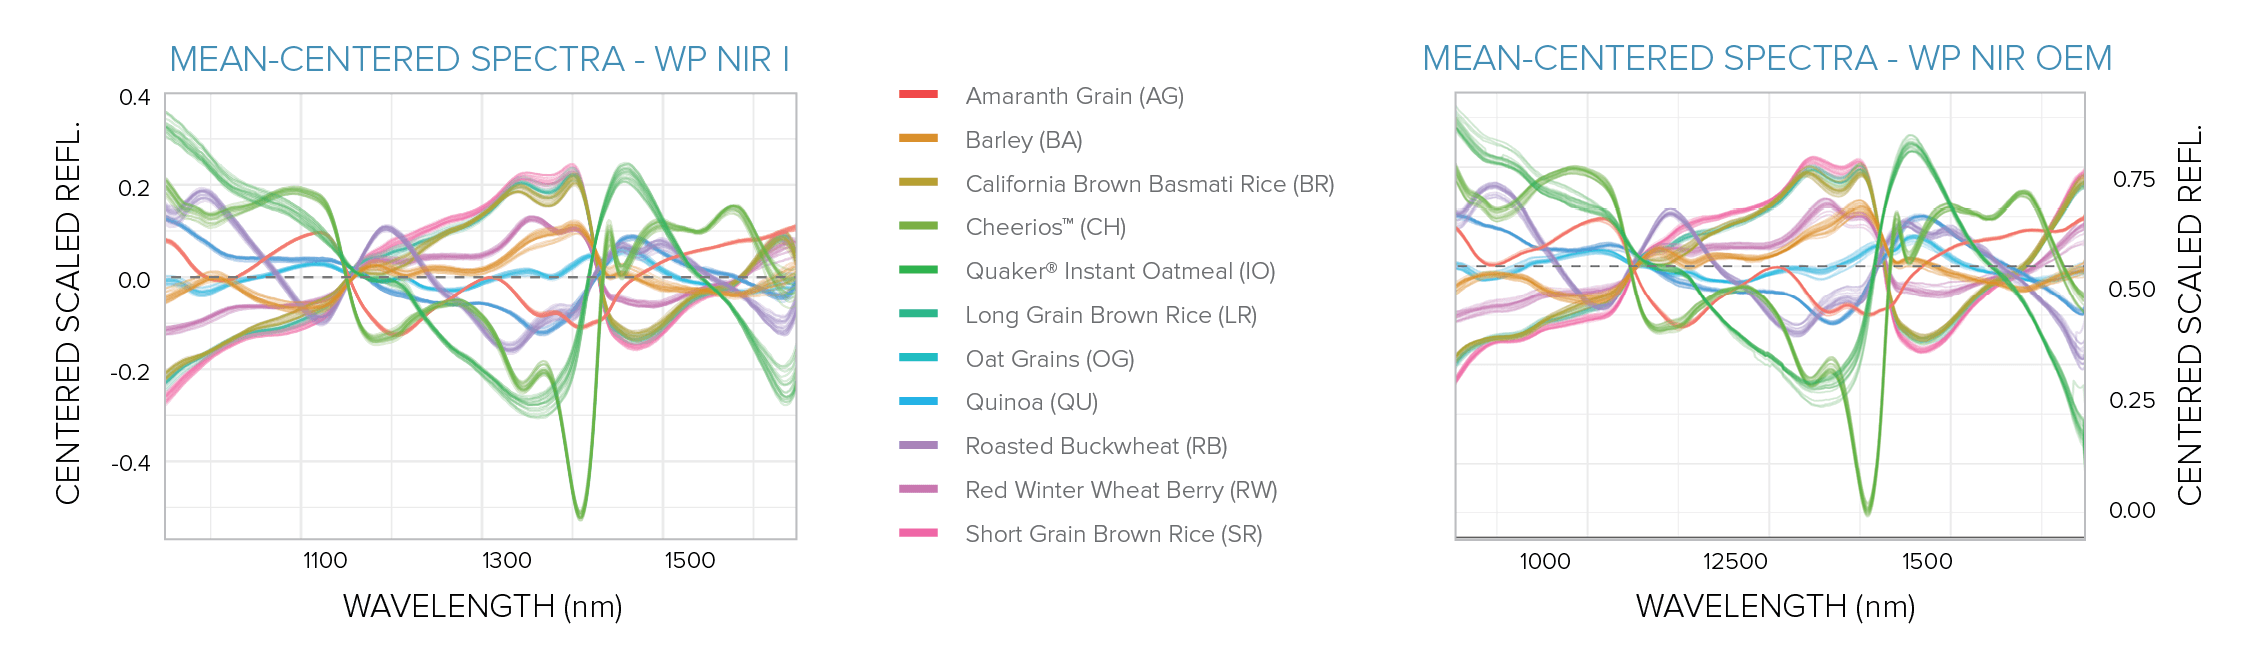
Looking at the spectra from our WP NIR I and its OEM module equivalent, we find both sets of difference spectra to be very comparable, indicating a very similar performance of the two spectrometers. This is very promising for robust method development, and transfer of that method from lab to field for grain identification.
Putting Spectra to the Test with PCA
Principal component analysis (PCA) is a simple multivariate method we can use to isolate the primary features (or components) that combine to yield each unique grain spectrum – a factorization of sorts to help visualize similarities between the spectra. Performing PCA on the scaled and mean-centered spectra from 950 to 1650 nm, we find that both our off-the-shelf and OEM spectrometers yield a very similar distribution of the importance of principal components. To illustrate the contributions of each principal component to each spectrum, we can plot the pairwise scores of the first three principal components for these PCA results. In this, each spectrum taken for each grain is represented by a point in each panel, with points plotted with transparency to visualize any overlap.
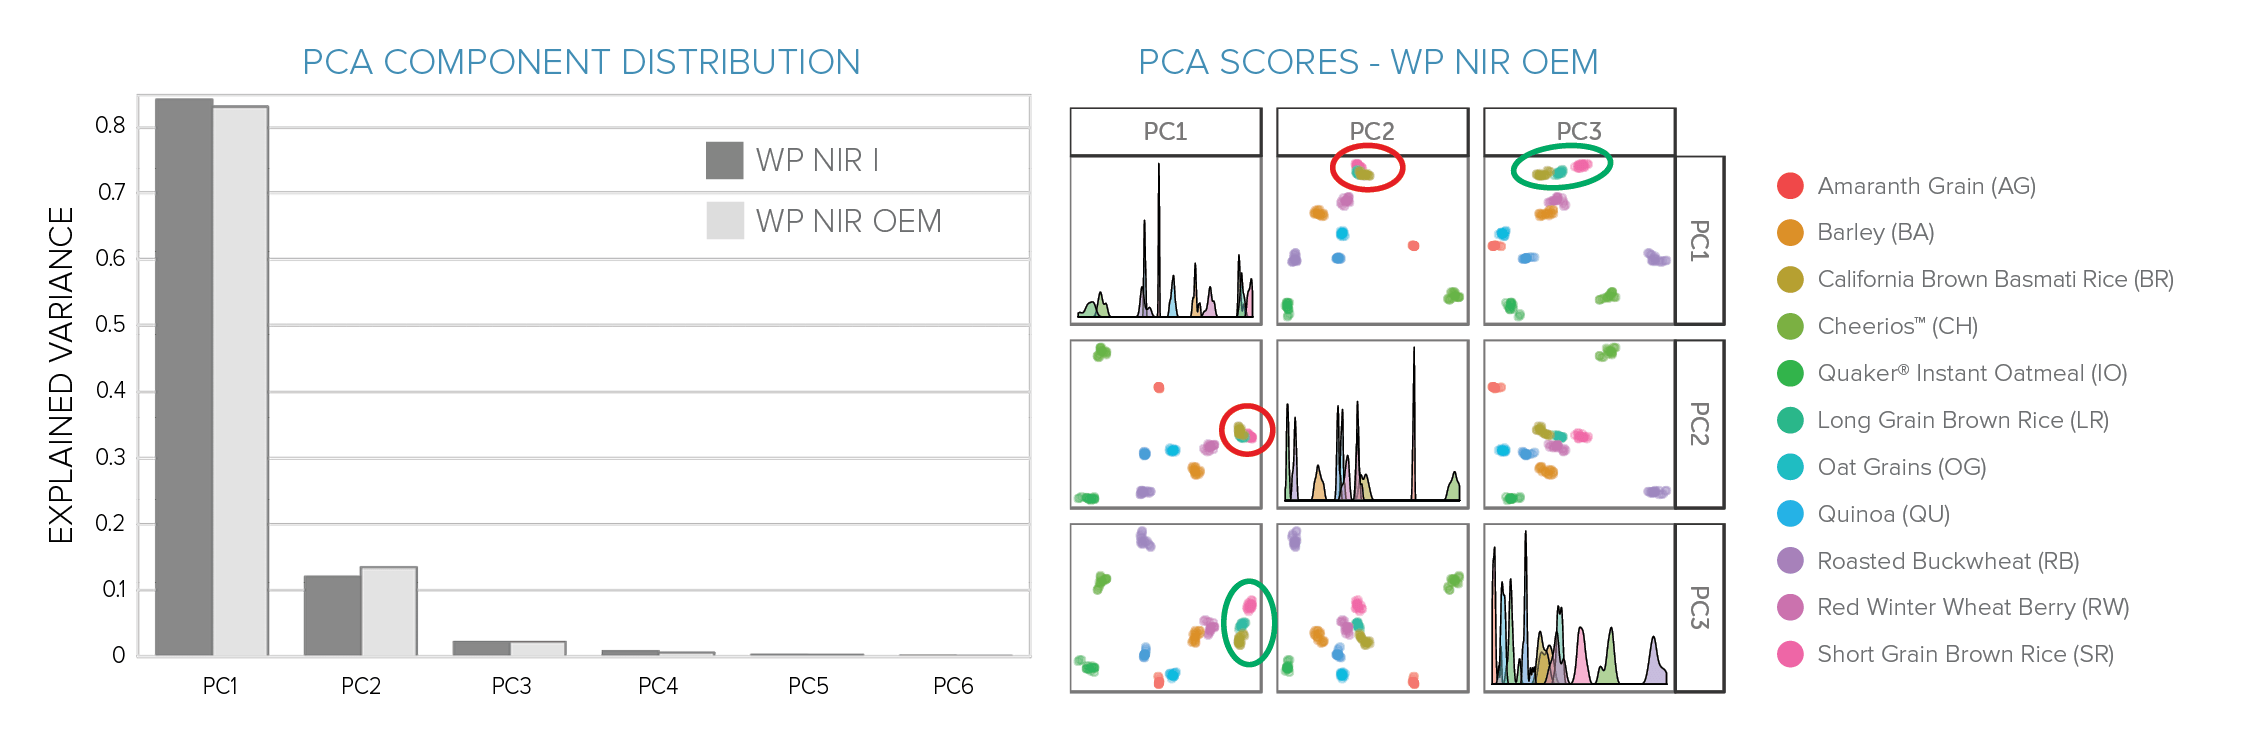
From this, we can see that the grains separate very nicely in multiple dimensions, even when considering only the first two principal components (PC1 and PC2). The only overlap between grains noticeable in these components, in fact, are the three brown rice samples: long-grain, short-grain, and California basmati rice (circled in red). Looking at PC3, even those separate well (circled in green), showing strong promise for distinction between varieties of the same grain. The good separation of the groups can also be noticed in the very sharp distributions plotted along the diagonal.
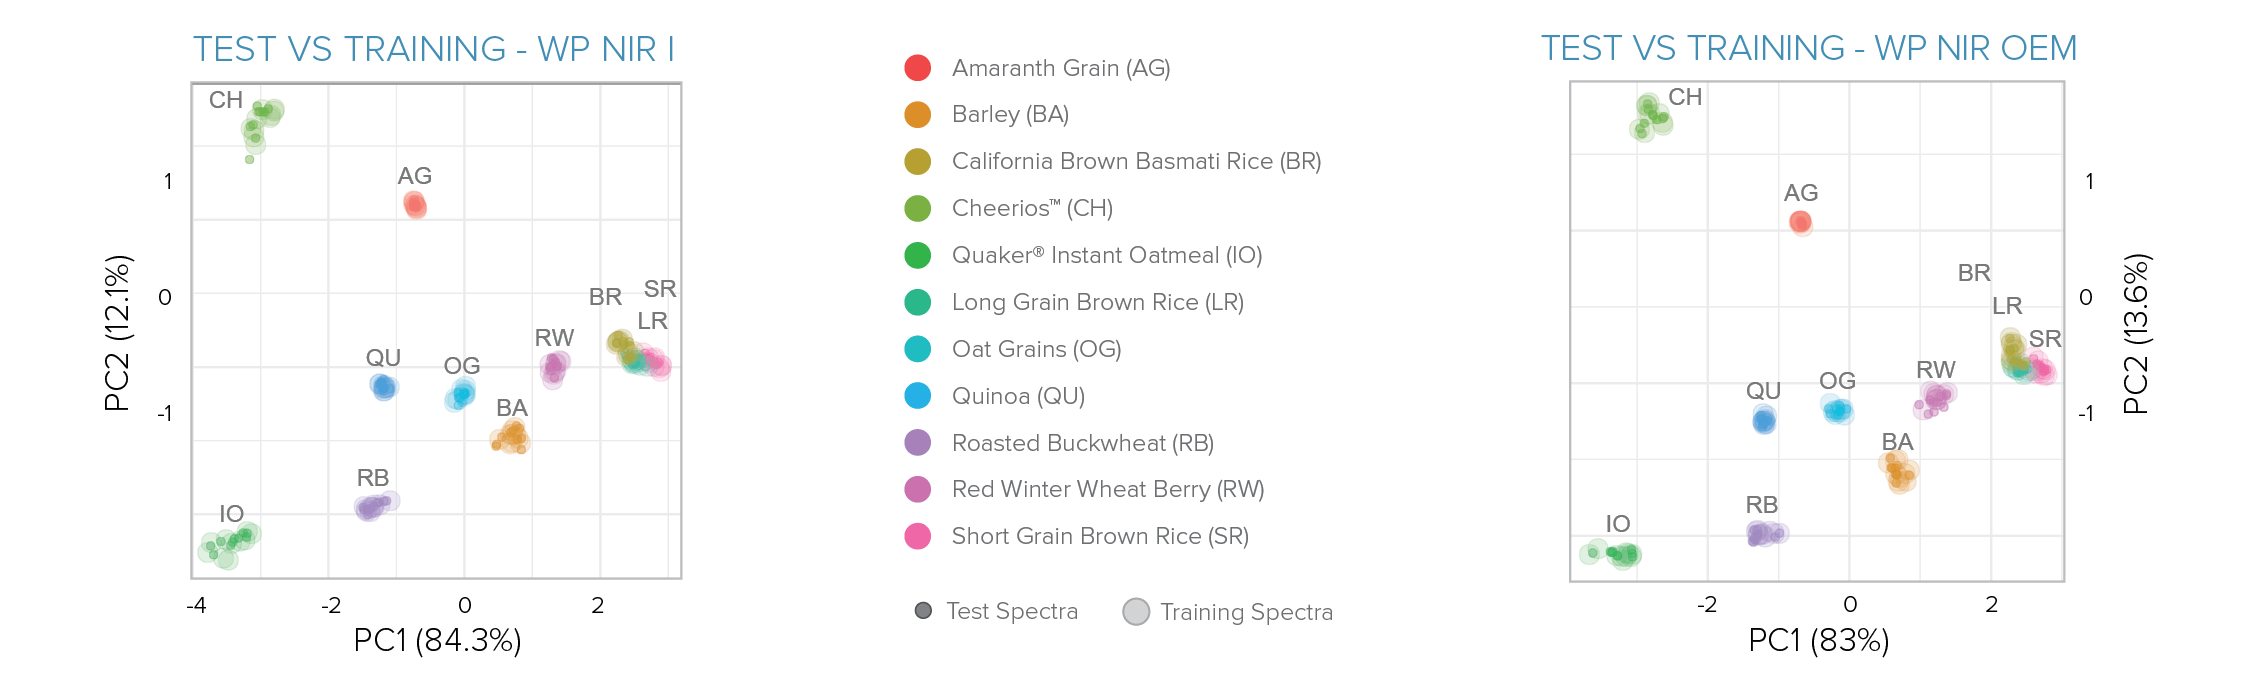
Taking this a step further, we divided our grain spectra into two groups of ten to form training and test sets, plotting the first two principal components for each and using large semi-transparent circles for the training group, and smaller dots for the test group (see next page). The PCA plots for both our benchtop and OEM module NIR spectrometers showed remarkably similar results. In both cases, the analysis yielded close distributions for each grain type, with all test samples falling well within the training group distributions. The point groups are tightest for small grains (amaranth, quinoa) and more spread out and further from the center of the distribution for large objects (Cheerios™, instant oatmeal). The only overlap seen was between the three varieties of brown rice: long grain, short grain, and California basmati. Even within this group, the distributions were tight, with only minimal overlap between long grain vs California basmati, and between long grain vs short grain brown rice.
More Sophistication with SIMCA
Confident in our ability to distinguish between grains, we were ready to classify unknowns. Soft Independent Modeling of Class Analogy (SIMCA) is a simple but popular classification method based on PCA. Multiple PCA models are generated, one for each class of samples (‘Independent Modeling’). New measurements are tested against each model in turn; in SIMCA they might be assigned to one class, multiple classes, or none at all.
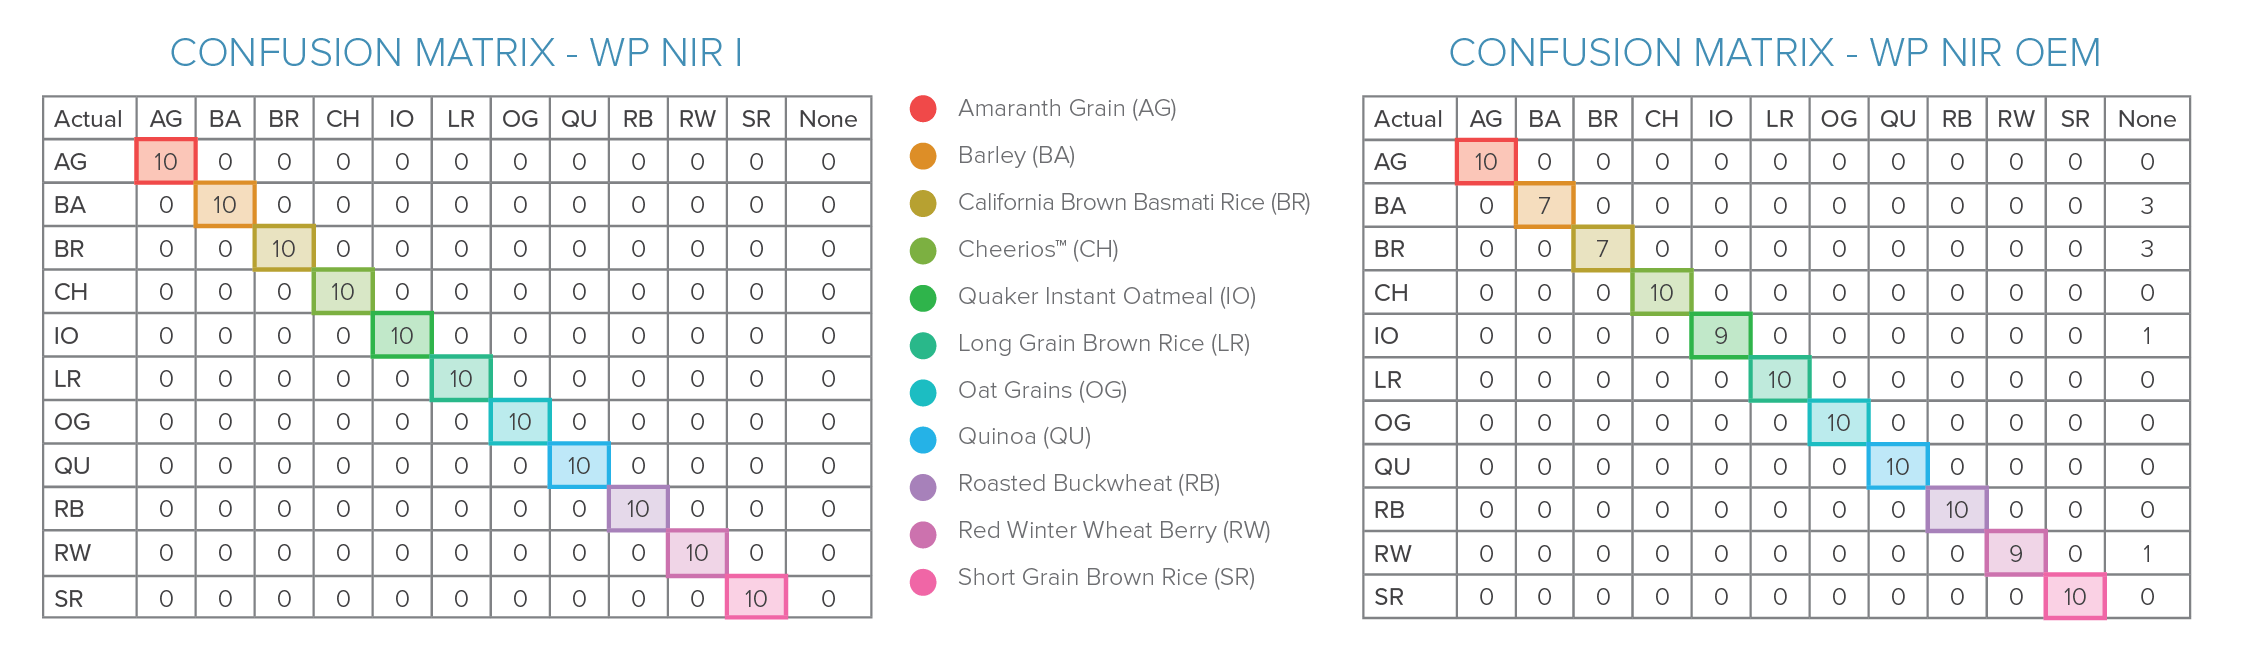
Using three principal components to define the PCA space, we tested the 10 ‘unknown’ spectra for each grain type against our SIMCA classes. The resulting confusion matrices above indicated perfect prediction of the sample identity for the WP NIR I, and eight unclassified samples for its OEM equivalent (i.e., none of the models yielded a high enough matching probability at the defined thresholds). Given the limited training set from which the SIMCA classes were built, this could easily be addressed using a larger data set and further model optimization, as would be appropriate for any method development.
Granular Separation
Diffuse NIR reflection spectra performed on a dozen grain types showed clear separation in the first three principal components, and successful identification with a multi-class SIMCA classifier developed using the same data set. Results for our off-the-shelf WP NIR I and its design-ready drop-in equivalent (WP NIR OEM) showed excellent agreement at every stage of analysis – and no misclassifications – demonstrating the strong potential of our spectrometers to contribute to grain analysis and grain identification in the food industry, from field to finished product.
To learn more about our NIR spectrometers and how they can benefit your application, contact us today.
 Loading...