
Choosing the Best Spectrometer for Advanced Chemical and Material Analysis
Selecting optical instrumentation for characterising advanced materials is rarely straightforward. Whether you are inspecting thin films in an Eindhoven cleanroom, formulating polymers in Chemelot, or analyzing bio-based compounds near Wageningen, your choice of analytical hardware determines your spectral accuracy, limits of detection, and workflow speed. High-performance spectrometers form the backbone of modern analytical laboratories, yet matching the underlying physics of an instrument to your sample matrix requires looking past glossy datasheet specifications.
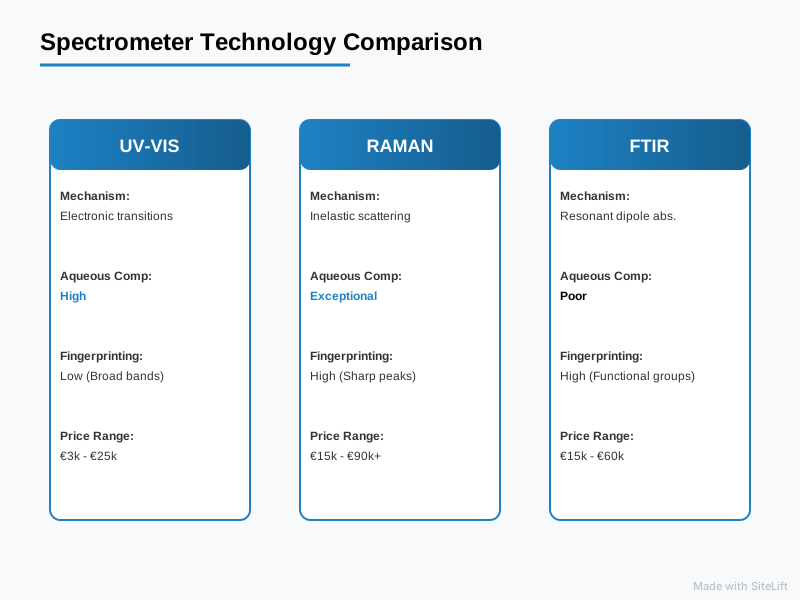
To make an informed capital investment, you must weigh raw optical performance against the realities of everyday sample handling. Below is an at-a-glance comparison of the three primary technologies used for advanced material and chemical analysis: UV-Vis, Raman, and FTIR systems.
| Analytical Criteria | UV VIS Spectrometer | Raman Spectrometer | FTIR Spectrometer |
|---|---|---|---|
| Primary Mechanism | Electronic transitions (UV-Vis absorption) | Inelastic light scattering (vibrational modes) | Resonant dipole absorption (infrared vibrational) |
| Spectral Range | 190 nm – 1100 nm | 50 cm⁻¹ – 4000 cm⁻¹ (Raman shift) | 4000 cm⁻¹ – 400 cm⁻¹ (Mid-IR) |
| Sample Preparation | Moderate to High (dilution, liquid cuvettes) | None to Minimal (direct non-contact measurement) | Moderate (ATR contact, pellets, thin films) |
| Aqueous Sample Compatibility | High (water does not absorb in UV-Vis) | Exceptional (water is a weak Raman scatterer) | Poor (strong mid-IR water absorption masks peaks) |
| Structural Fingerprinting | Low (broad, overlapping electronic bands) | High (sharp, compound-specific fingerprint bands) | High (comprehensive organic functional group analysis) |
| Estimated Price Range | €3,000 – €25,000 | €15,000 – €90,000+ | €15,000 – €60,000 |
| Key Strengths | Quantitative concentration, bandgap analysis | Non-destructive, microscopic mapping, aqueous samples | Rapid organic identification, mature library search |
| Main Limitations | Poor chemical specificity in complex mixtures | Fluorescence interference, weak Raman scattering | Water masking, requires mechanical pressure on ATR crystal |
How Do You Evaluate Spectrometers for Advanced Chemical and Material Analysis?
Before diving into individual instruments, establishing an objective benchmarking framework is essential. The global process spectroscopy market is projected to expand at a CAGR of 7.2% through 2030, according to data from Grand View Research, largely propelled by automated, inline quality control across semiconductor and pharmaceutical production lines. To deploy these tools effectively, engineers must assess three critical criteria.
Core Technical Metrics: Spectral Range, Resolution, and Dynamic Range
The first technical hurdle is aligning the optical layout with your target analytes:
- Optical Resolution vs. Spectral Range: Governed by the entry slit width, the focal length of the optical bench, and the groove density of the diffraction grating. A narrow slit (e.g., 10 µm) paired with an 1800 lines/mm grating yields sub-nanometre resolution, resolving subtle peak splits in crystal polymorphs. However, this configuration limits your overall spectral window and reduces the system’s light-gathering power (étendue).
- Detector Architecture: Optical engines rely on front-illuminated CMOS, back-thinned charge-coupled devices (CCDs), or Indium Gallium Arsenide (InGaAs) linear arrays. Back-thinned CCDs with thermoelectric cooling (-60 °C or lower) offer exceptional quantum efficiency and low readout noise, which are essential for low-light vibrational measurements.
- Dynamic Range and SNR: High dynamic range (typically 16-bit ADCs yielding >10,000:1 signal-to-noise ratios) allows you to quantify trace components right next to saturated solvent peaks without suffering from blooming or baseline drift.
Pro Tip: Never evaluate resolution using software interpolation alone. Insist on verifying the Full Width at Half Maximum (FWHM) of an atomic emission line—such as low-pressure mercury-argon or neon lamps—to confirm actual physical resolution across your operational spectrum.
Sample Constraints: Non-Destructive Testing vs. Chemical Preparation
Advanced materials, such as operational semiconductor wafers or delicate organic photovoltaic layers, rarely tolerate destructive preparation:
- Non-Destructive Testing (NDT): Optical methods should preserve sample morphology and chemical integrity. Systems that accommodate long working distance microscope objectives or fiber-optic probes bypass extraction and chemical digestion steps.
- Phase and Matrix Sensitivity: Highly scattering powders, turbid emulsions, and opaque solids pose optical challenges like beam attenuation and pathlength uncertainty. For a deeper look at the optical fundamentals governing stray light and resolution across various matrices, consult the Spectroscopy Knowledge Center.
Integration and Form Factor: Benchtop Systems vs. Modular In-Line Optical Spectroscopy Systems
Your operational footprint dictates whether an integrated benchtop instrument or a modular optical assembly is the right fit. Turnkey benchtop spectrometers feature sealed, purged beam paths designed for centralized analytical labs running regulated workflows.
Conversely, modular optical spectroscopy systems decouple the light source, sample interface, optical fibers, and spectrometer engine. This flexibility allows researchers to embed fiber probes directly into ultra-high vacuum (UHV) chambers, flow chemistry lines, or automated wafer inspection gantries.
According to Photonics21, the European photonics market accounts for over €100 billion, with core optical test and measurement instrumentation growing at over 7% annually. This momentum is reflected in the Dutch high-tech sector, where modular architectures are increasingly preferred for cleanroom and pilot-line integration.
Infographic by SiteLift
UV VIS Spectrometer: Capabilities, Strengths, and Limitations
A UV VIS spectrometer measures light attenuation as a function of wavelength across the ultraviolet (190–380 nm) and visible (380–780 nm) regions, extending in some models into the short-wave near-infrared (up to 1100 nm).
[Broadband Light Source] ---> [Sample Cell] ---> [Diffraction Grating] ---> [Array Detector]
  (Deuterium + Halogen)      (Absorbs specific      (Disperses light)        (Measures I/I₀)
                               electronic bands)
Primary Working Principle: Electronic Transitions and Quantitative Absorption
When valence electrons absorb photons of matching energy, they transition from the highest occupied molecular orbital (HOMO) to the lowest unoccupied molecular orbital (LUMO). In materials science, this mechanism provides a direct, non-destructive way to measure the optical bandgap of semiconductors (via Tauc plots), evaluate thin-film transmission coatings, and monitor chromophore degradation.
Key Strengths: Robust Quantitative Analysis and Regulatory Compliance
- Unmatched Quantitative Linearity: Governed by the Beer-Lambert law ($A = epsilon cdot c cdot l$), UV-Vis instruments offer exceptional quantitative linearity over three to four orders of magnitude.
- Kinetic Studies: Fast-acquisition array systems can record entire spectra in milliseconds, making them ideal for monitoring rapid chemical reaction kinetics or photochemical degradation in real time.
- Simplicity and Compliance: With established European Pharmacopoeia (Ph. Eur.) and ASTM standards, validating a UV-Vis workflow in regulated industries remains straightforward and cost-effective.
Technical Constraints: Low Structural Fingerprinting in Complex Matrixes
- Broad Absorption Bands: Electronic transitions yield broad, continuous spectral envelopes rather than sharp vibrational peaks. If your sample contains multiple organic compounds absorbing between 250 nm and 320 nm, deconvolution becomes unreliable without upfront chromatographic separation (e.g., HPLC-UV).
- Matrix Limitations: Samples must be transparent or translucent. Highly scattering turbid liquids or opaque substrates require integrating spheres for diffuse reflectance measurements, which increases system complexity and cost.
Raman Spectrometer: Molecular Fingerprinting Without Sample Contact
A Raman spectrometer probes the vibrational, rotational, and other low-frequency modes of a system using monochromatic laser radiation.
Inelastic Scattering and High-Resolution Vibrational Fingerprints
When high-intensity laser light illuminates a molecule, the vast majority of photons scatter elastically (Rayleigh scattering) at the excitation wavelength. A tiny fraction undergoes inelastic Raman scattering, losing or gaining energy corresponding directly to the molecular vibrational bond energies:
$$Delta tilde{nu} = frac{1}{lambda_{text{excitation}}} – frac{1}{lambda_{text{scattered}}}$$
This energy shift yields narrow, highly characteristic spectral bands, giving you an unambiguous structural fingerprint of the analyte.
Key Strengths: Zero Contact, Aqueous Sample Compatibility, and Microscopic Mapping
- Non-Contact and In Situ: Raman measurements can be acquired directly through optical windows, glass vials, quartz cuvettes, and protective packaging.
- Aqueous Immunity: Unlike infrared radiation, water yields exceptionally weak Raman scattering. This makes Raman an ideal analytical tool for aqueous chemistry, biological tissues, and microfluidic assays.
- Microscopic Spatial Resolution: Confocal Raman systems can achieve diffraction-limited lateral spatial resolution down to ~500 nm, allowing users to map stress fields in silicon wafers, track active pharmaceutical ingredient (API) distribution, and isolate graphene layers. Those seeking this capability in field-ready form can explore the miniRaman Spectrometer for portable characterisation without losing spectral clarity.
Technical Constraints: Weak Scattering Efficiency and Laser-Induced Fluorescence
- Low Inelastic Scattering Cross-Section: Data published by NIST indicates that Raman spectroscopy signal efficiency represents approximately 1 in $10^6$ to $10^8$ incident photons. Detecting this faint signal requires low-noise, thermoelectrically cooled CCD arrays and narrow optical notch filters to block the incident laser line.
- Fluorescence Overlap: Autofluorescence from organic matrices or trace impurities can easily swamp weak Raman signals. Choosing the right laser excitation is essential:
- 532 nm: Strong Raman signal ($propto lambda^{-4}$ cross-section scaling), but high risk of triggering fluorescence. Ideal for inorganic materials, semiconductors, and carbon allotropes.
- 785 nm: The industry standard balancing signal intensity and fluorescence suppression.
- 1064 nm: Virtually eliminates autofluorescence in biological or complex organic materials, though it requires sensitive InGaAs detectors that increase overall system costs.
FTIR Spectrometer: High-Throughput Infrared Structural Analysis
Fourier Transform Infrared (FTIR) spectroscopy remains the benchmark technique for identifying organic compounds, polymers, and surface coatings.
Interferometric Detection and Wide Mid-IR Absorption
Rather than dispersing light across a grating, an FTIR system uses a Michelson interferometer to modulate broad-spectrum infrared light. The sample absorbs specific infrared frequencies that match its dipole vibrational modes, producing an interferogram. Applying a fast Fourier transform converts this raw interference signal into an absorbance spectrum spanning 4000 cm⁻¹ to 400 cm⁻¹.
Thanks to the Fellgett (multiplex) and Jacquinot (throughput) advantages, FTIR systems gather more optical signal faster than traditional dispersive infrared instruments, yielding exceptional signal-to-noise ratios across wide spectral bands.
Key Strengths: Fast Identification of Organic Functional Groups
FTIR excels at identifying unknown organic substances using extensive commercial spectral libraries. It cleanly detects carbonyls, hydroxyls, amines, and aromatic rings within seconds. Additionally, FTIR and Raman spectroscopy complement one another via the mutual exclusion principle: in centrosymmetric molecules, vibrational modes that are active in FTIR are inactive in Raman, and vice versa.
Technical Constraints: Water Absorption Artifacts and Sample Contact (ATR Requirements)
- Broad Infrared Water Absorption: Water absorbs mid-IR radiation strongly, obscuring critical fingerprint regions from 3000–3700 cm⁻¹ and 1600–1700 cm⁻¹. This makes analyzing dilute aqueous solutions with transmission FTIR exceptionally challenging.
- Mechanical Contact in ATR: Attenuated Total Reflectance (ATR) requires pressing the sample directly against an internal reflection element, typically a diamond or germanium crystal. This physical contact can alter the surface morphology of soft materials, risk abrasive damage to the crystal, and lead to poor optical coupling on rigid, uneven surfaces. Compact MEMS-based options like NeoSpectra FT-NIR spectral sensors help alleviate these mechanical constraints in the near-infrared spectrum by enabling direct, portable reflectance measurements.
Spectrometers Head-to-Head: Comparative Analysis and Performance Matrix
When configuring spectrometers for analytical environments, selecting the right platform comes down to trading off optical resolution, chemical specificity, and operational requirements.
       [ HIGH ] +---------------------------------------------------+
                |                                                   |
                |         Raman Spectrometer                        |
                |         - Non-contact, aqueous-friendly           |
  Chemical      |         - High spatial resolution                 |
  Specificity   |                                                   |
                |                         FTIR Spectrometer         |
                |                         - Organic functional groups|
                |                         - Extensive libraries      |
                |                                                   |
                |  UV VIS Spectrometer                              |
                |  - Fast quantitative absorption                   |
                |  - Bandgap determination                          |
        [ LOW ] +---------------------------------------------------+
                [ LOW ]              Spectral Complexity          [ HIGH ]
Feature Comparison Matrix
| Technical Parameter | UV-Vis Spectrometer | Dispersive Raman System | Mid-IR FTIR (with ATR) |
|---|---|---|---|
| Typical Spectral Resolution | 0.5 nm to 2.0 nm | 1.0 cm⁻¹ to 4.0 cm⁻¹ | 0.5 cm⁻¹ to 4.0 cm⁻¹ |
| Spectral Coverage | 190 – 1100 nm | 50 – 4000 cm⁻¹ shift | 4000 – 400 cm⁻¹ |
| Spatial Resolution Limit | Macro (~mm beam spot) | Confocal diffraction limit (~0.5 µm) | Diffraction limited (~10–20 µm) |
| Sample Prep Requirement | Dilution / Filtration | Zero (measure through container) | Direct crystal clamping |
| Aqueous Sensitivity | Unaffected | Unaffected | Severely attenuated |
| Typical Measurement Time | 10 ms to 1 s | 500 ms to 30 s | 1 s to 15 s |
| Consumables Required | Cuvettes, reference solvents | None | None |
Cost-of-Ownership and Operational Complexity Comparison
Beyond the initial purchase price, these platforms have distinct ongoing maintenance requirements:
- Light Source Lifespans: UV-Vis systems rely on deuterium arc lamps that require replacement after 1,000 to 2,000 operating hours, alongside regular baseline calibrations. FTIR instruments use ceramic IR emitters (globar sources) that last significantly longer, though their beam splitters (like KBr) can degrade without proper humidity control. Raman systems rely on solid-state laser diodes with lifespans exceeding 10,000 hours, though their wavelengths must stay temperature-stabilized to avoid shift drift.
- Detector Cooling Maintenance: Deeply cooled back-thinned detectors (running down to -70 °C via multi-stage Peltier elements) eliminate thermal dark current, but they draw considerable power and require reliable heatsinking.
- Operational Overhead: UV-Vis workflows require solvent handling, cuvette cleaning, and dilution protocols. By comparison, Raman and FTIR platforms minimize consumable costs, shifting the operational focus toward data analysis and spectral library management.
Pro Tip: When calculating total cost of ownership for UV-Vis or Raman systems, look closely at stray light suppression. A stray light rating of <0.05% in your optical engine directly broadens your dynamic range, preventing baseline distortion when working with high-optical-density samples.
Why Modular Optical Spectroscopy Systems Are Underrated
In our experience across the photonics sector, analytical teams often default to closed, turnkey benchtop systems without weighing the operational advantages of modular setups.
While a turnkey instrument offers standard push-button operation, it locks you into a single optical geometry, fixed focal length, and proprietary software stack. If your research shifts from polymer thin-film transmission to low-angle specular reflectance or wafer surface photoluminescence, a closed system often leaves you shopping for an entirely new platform.
Building a setup from modular optical spectroscopy systems offers unmatched flexibility:
- Interchangeable Gratings and Slits: You can easily swap your optical engine from an 1800 lines/mm holographic grating (optimized for high-resolution 532 nm Raman) to a 600 lines/mm blazed grating covering broad UV-Vis-NIR bands.
- Probe and Illumination Independence: Using standard SMA-905 or FC/PC fiber connections, you can swap out reflection probes, integrating spheres, flow cells, and long-working-distance collimators without disrupting the core detector array.
- Direct Automation Integration: Modular systems offer open APIs (Python, LabVIEW, C++), enabling cleanroom operators and manufacturing engineers to integrate spectral acquisitions directly into automated motion-control stages or internal SCADA networks.
For fast-evolving research labs and pilot manufacturing lines, this modular approach protects your instrumentation investment far better than a closed benchtop system.
Which Optical Spectroscopy System Fits Your Specific Dutch Industry or Research Lab?
The diverse industrial and research landscape of the Netherlands demands specialized analytical configurations:
Semiconductor, Nanotech, and Thin-Film R&D (Brainport / Eindhoven Region)
Cleanrooms throughout the Brainport Eindhoven ecosystem require sub-nanometre thin-film characterisation, non-destructive wafer stress analysis, and precise inspection of photonics integrated circuits (PICs).
- The Ideal Setup: A dual configuration pairing a modular UV VIS spectrometer (for optical bandgap, film thickness, and reflectivity metrics via SPIE standard methodologies) with a confocal 532 nm / 785 nm Raman spectrometer.
- Why It Excels: This setup lets engineers monitor 2D materials like graphene and transition metal dichalcogenides (TMDs) while characterizing optical layers on patterned silicon without mechanical contact.
Agri-Food and Water Quality Monitoring (Wageningen Ecosystem)
The Foodvalley cluster centered around Wageningen focuses on rapid quality testing of plant tissues, dairy streams, process water, and bio-based polymers.
- The Ideal Setup: A portable Raman spectrometer (using 785 nm or 1064 nm excitation) or an inline FT-NIR spectral sensor.
- Why It Excels: These systems measure directly in water-heavy matrices, bypassing the intense infrared water absorption bands that compromise mid-IR transmission setups. Technicians can measure milk proteins, dissolved nutrients, or microplastics right through aqueous flows.
Academic and Fundamental Materials Research (Dutch University Laboratories)
Institutions such as TU Delft, TU Eindhoven, the University of Twente, and the University of Groningen tackle multidisciplinary challenges that demand flexible instrumentation.
- The Ideal Setup: A high-resolution dispersive optical spectrometer featuring interchangeable diffraction gratings, deep detector cooling, and fiber-coupled sampling accessories.
- Why It Excels: Modular components support varied experiments across physical chemistry, quantum materials, and catalysis labs, providing the reconfigurability required for long-term academic research.
To systematically match your exact spectral requirements with available hardware, you can use the Evolve Spectrometer Selector to compare optical configurations based on resolution, range, and detector chemistry.
Partnering with Te Lintelo Systems (TLS)
Navigating the trade-offs between optical resolution, optical throughput (étendue), detector sensitivity, and sample matrices requires hands-on photonics experience. Since 1985, Te Lintelo Systems (TLS) has supported Benelux research teams and high-tech manufacturers with advanced solutions for light emission, manipulation, and detection.
Whether you are building custom optical test benches or integrating high-speed process spectroscopy directly into a production line, TLS connects you with industry-leading components. Explore our broad portfolio of precision Spectrometers or consult with our photonics engineers to design an optical configuration tailored to your analytical workflows.
We believe that selecting an analytical instrument should never involve guesswork. By matching your sample physics directly to the right detector architecture and optical bench, you build an analytical setup that delivers clear, repeatable results for years to come.
— tlsbv.nl
Frequently Asked Questions About Choosing Optical Spectrometers
What is the difference between a Raman spectrometer and a UV VIS spectrometer?
A UV VIS spectrometer measures electronic transitions by tracking how much ultraviolet and visible light a sample absorbs at specific wavelengths, making it ideal for quantifying concentrations and measuring semiconductor bandgaps. A Raman spectrometer uses monochromatic laser excitation to detect inelastically scattered light, revealing narrow vibrational bands that produce a detailed chemical fingerprint of the sample’s molecular bonds.
Can a single spectrometer cover both UV-Vis and NIR spectral ranges effectively?
Yes, wide-range spectrometers can bridge from 200 nm up to 1100 nm using broad-blaze diffraction gratings and wide-band silicon-based detectors. However, extending beyond 1100 nm into the short-wave infrared (SWIR) requires a secondary InGaAs detector array. Broad-spectrum systems also sacrifice some optical resolution compared to instruments configured with high-groove-density gratings optimized for narrower spectral windows.
How does optical resolution impact material identification in advanced spectroscopy?
Optical resolution—determined by the entrance slit width, focal length, and grating groove density—dictates your ability to separate closely spaced spectral lines. In crystallographic analysis, polymer characterisation, and semiconductor stress measurements, sub-nanometre resolution is critical for detecting subtle peak splitting, shifts, and phase changes that broad-resolution systems miss entirely.
Why is fluorescence an issue in Raman spectroscopy, and how is it mitigated?
Autofluorescence occurs when a sample absorbs the excitation laser light and re-emits photons at overlapping wavelengths. Because fluorescence is quantum-mechanically far more efficient than the weak Raman scattering process (often by six to eight orders of magnitude), it can easily overwhelm the Raman signal. You can mitigate this issue by using longer laser wavelengths (such as 785 nm or 1064 nm), applying baseline subtraction algorithms, or using time-gated detection.
When should an analytical lab choose modular optical spectroscopy systems over turnkey spectrometers?
Laboratories should opt for modular optical spectroscopy systems when their work requires custom sampling geometries, automated process integration, variable excitation sources, or future hardware upgrades. While turnkey spectrometers offer standardized operation for routine quality control, modular systems give materials science and photonics teams the freedom to adapt their optical bench to changing experimental needs.