
Ultraviolet Visible Spectroscopy UV Vis: Principles and Applications for Dutch Labs
Whether you are qualifying monoclonal antibodies at the Leiden Bio Science Park, verifying thin-film optical coatings in Brainport Eindhoven, or testing greenhouse runoff across the Westland, ultraviolet visible spectroscopy uv vis remains an indispensable analytical technique. It is one of the most reliable, cost-effective, and versatile tools in modern photonics and analytical chemistry.
Yet, despite its ubiquitous presence on laboratory benches across the Netherlands, many practitioners treat the technique as a simple “black box.” Placing a sample into a UV Vis spectrophotometer and pressing “measure” will yield a number—but understanding the underlying physical transitions, optical trade-offs, and systematic sources of error is what separates reproducible data from flawed assays.
In this guide, we dive deep into the fundamental physics, optical engineering, sample preparation, and rigorous regulatory standards that define modern UV Vis metrology in Dutch academic and industrial laboratories.
What Is Ultraviolet Visible Spectroscopy UV Vis and How Does It Work?
At its core, ultraviolet visible spectroscopy uv vis measures how much electromagnetic radiation a sample absorbs across the ultraviolet (190 to 380 nm) and visible (380 to 780 nm) spectral regions, often extending into the near-infrared (NIR) up to 1100 nm.
When light passes through a liquid sample, solid film, or gas, specific wavelengths lose intensity. By quantifying that loss, researchers can identify chemical compounds and calculate precise solute concentrations.
[ Light Source ] ---> [ Monochromator ] ---> [ Sample (Cuvette) ] ---> [ Photodetector ]
     (I₀)                 (Selected λ)             (Transmitted I)            (A = -log₁₀ T)
The Electromagnetic Spectrum: Electronic Transitions in UV and Visible Regions
The interaction between matter and light in the UV-Vis range is fundamentally electronic. Unlike infrared spectroscopy, which excites vibrational modes within chemical bonds, UV-Vis photons carry sufficient energy to promote valence electrons from ground-state orbitals to higher-energy excited states.
Chemically, these transitions typically move electrons from the Highest Occupied Molecular Orbital (HOMO) to the Lowest Unoccupied Molecular Orbital (LUMO):
- $pi rightarrow pi^*$ transitions: Common in unsaturated molecules containing conjugated double bonds, aromatic rings (like tryptophan or phenylalanine in proteins), and synthetic dyes. These transitions are intense and exhibit high molar absorptivities.
- $n rightarrow pi^*$ transitions: Occur in molecules with non-bonding lone pairs adjacent to double bonds (such as carbonyl, nitro, or heterocyclic groups). These transitions generally require less energy (longer wavelengths) but show lower transition probabilities and lower absorption peaks.
- Charge-transfer transitions: Common in inorganic coordination complexes and metal-organic frameworks, where an electron transfers between a metal core and an organic ligand.
Because conjugated systems lower the energy gap between the HOMO and LUMO levels, extending conjugation shifts the absorption maximum toward longer wavelengths—a phenomenon known as a bathochromic shift (or red shift). Conversely, shifting toward shorter wavelengths is termed a hypsochromic shift (blue shift).
Fundamental Principles: Absorbance Measurement and Transmittance
To quantify this electronic absorption, an instrument measures the radiant power of the light beam before entering the sample ($I_0$) and after emerging from it ($I$).
Transmittance ($T$) is defined by the International Union of Pure and Applied Chemistry as the fraction of incident light that passes completely through the optical path:
$$T = frac{I}{I_0}$$
Because transmittance scales exponentially with path length and concentration, it is converted into a linear scale called absorbance measurement ($A$), historically referred to as optical density (OD):
$$A = -log_{10}(T) = log_{10}left(frac{I_0}{I}right)$$
When a sample absorbs 90% of the incident light ($T = 0.1$), the absorbance is 1.0. When it absorbs 99% ($T = 0.01$), the absorbance is 2.0. At an absorbance of 3.0, only 0.1% of the original light reaches the detector. This logarithmic relationship is critical: measuring absorbances higher than 2.0 to 2.5 puts extreme demands on instrument sensitivity and optical dynamic range.
The Beer-Lambert Law: Quantifying Solute Concentration
Quantitative UV-Vis measurements rely on the Beer-Lambert law, which states that absorbance is directly proportional to both the concentration of the absorbing species and the path length of the optical cell:
$$A = varepsilon cdot b cdot c$$
Where:
- $A$ = Absorbance (dimensionless)
- $varepsilon$ = Molar absorptivity (or molar attenuation coefficient), expressed in $text{L}cdottext{mol}^{-1}cdottext{cm}^{-1}$
- $b$ = Optical path length through the sample, conventionally 1.0 cm
- $c$ = Molar concentration of the analyte ($text{mol}cdottext{L}^{-1}$)
The law assumes perfectly monochromatic light, non-interacting absorbing species, a completely homogeneous medium, and zero light scattering. In real-world lab workflows, deviations from linearity occur frequently.
At concentrations typically above 0.01 M, electrostatic interactions between neighboring solute molecules alter their charge distribution, shifting their absorption spectrum. Furthermore, optical factors—primarily stray light leaking past the monochromator—artificially suppress measured absorbance values at higher optical densities, creating a false plateau on your calibration curve.
What Are the Key Components of a Modern UV Vis Spectrophotometer?
To generate reproducible absorbance spectra, an instrument must coordinate stable light generation, high-precision wavelength selection, and sensitive optical detection.
Light Sources: Deuterium, Tungsten-Halogen, and Xenon Flash Lamps
A typical benchtop UV Vis spectrophotometer covers 190 to 1100 nm by pairing two distinct continuous emission sources:
- Deuterium Arc Lamps ($190 – 380text{ nm}$): Deuterium lamps produce continuous molecular emission in the deep UV spectrum. They require stable, temperature-regulated power supplies to prevent baseline drift.
- Tungsten-Halogen Lamps ($350 – 1100text{ nm}$): Operating on the incandescent blackbody radiation principle, these provide a smooth, broad emission profile covering the visible and near-infrared regions.
For industrial quality control or field-ready instruments, pulsed Xenon flash lamps are an alternative. They cover the entire 190–1100 nm range in a single envelope, emit minimal thermal load, and only fire during measurement cycles, extending operational lifetimes past a decade.
For advanced metrology setups requiring rock-solid baselines over long acquisition periods, deploying stable broad spectrum light sources for UV, visible and NIR spectroscopy is essential to reduce thermal drift.
Optical Selection: Monochromators vs. Polychromators and Dispersive Elements
Once white light is emitted, the optical engine must isolate specific wavelengths:
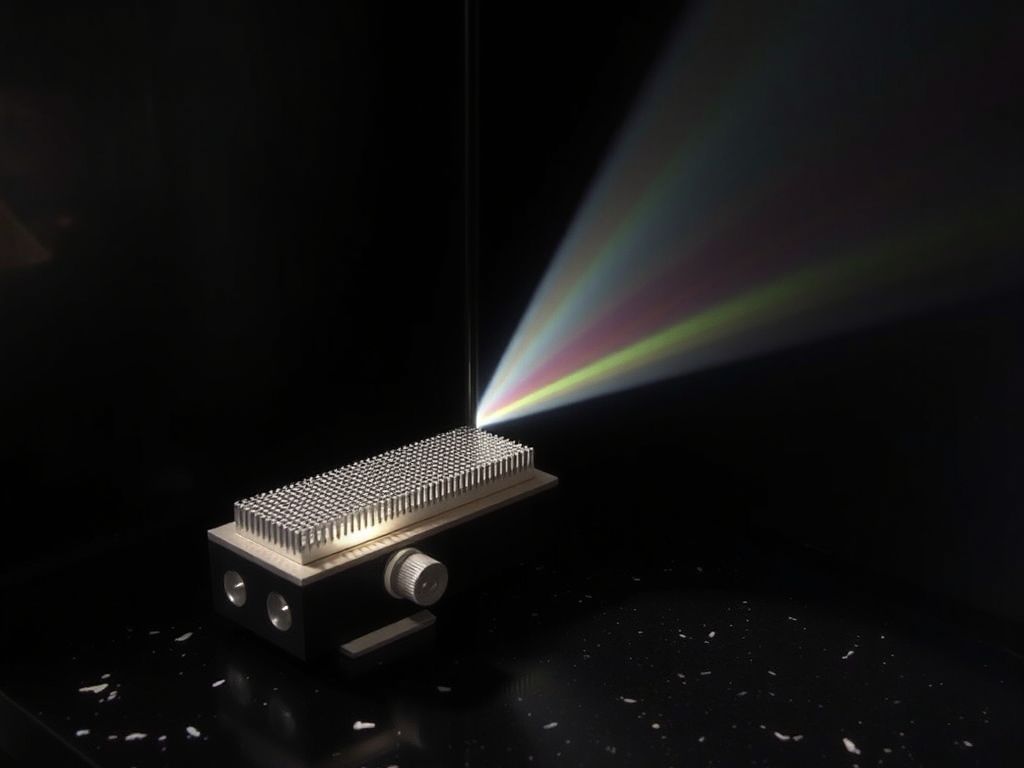
- Diffraction Gratings: Modern instruments use holographic reflection gratings etched with 1200 to 2400 grooves per millimeter. Blazed holographic gratings significantly reduce stray light and optical aberrations compared to classic ruled variants.
- Spectral Slit Width (Bandpass): The exit slit defines the spectral bandwidth (SBW) reaching the sample. A narrow slit (e.g., 0.5 to 1.0 nm) resolves fine vibronic structures in gaseous or aromatic compounds, while a wider slit (e.g., 2.0 to 4.0 nm) increases optical throughput and signal-to-noise ratio for routine liquid quantifications.
Single-Beam vs. Double-Beam and Photodiode Array (PDA) Configurations
The layout of the optical train dictates baseline stability and measurement speed:
- Single-Beam Architecture: Light follows a single path through the sample to the detector. Before measuring an unknown, the operator must record a blank reference. Single-beam systems are susceptible to source lamp drift during extended runs.
- True Double-Beam Architecture: A spinning chopper mirror or optical beam splitter splits the monochromatic beam into two physical paths: one traversing the sample cuvette, the other traversing a continuous solvent reference cuvette. This real-time referencing compensates dynamically for lamp fluctuations, making double-beam instruments the gold standard for high-precision analytical laboratories.
- Photodiode Array (PDA) / CCD Spectrometers: Rather than scanning a monochromator step-by-step, PDA systems pass broad white light through the sample first, then disperse the transmitted beam across a linear array detector (such as a charge-coupled device or CMOS array). Instruments like the high-resolution EagleEye UV-Vis Spectrometer capture a full, high-resolution spectrum from 190 to 1100 nm in milliseconds, making them ideal for kinetic studies, high-throughput screening, and online process monitoring.
Scanning Double-Beam:
[Source] -> [Monochromator] -> [Chopper] --> [Sample Path] ----> [Detector 1]
                                        --> [Reference Path] -> [Detector 2]

Array (PDA/CCD):
[Source] -> [Sample] -> [Polychromator Grating] -> [Linear Sensor Array (All λ at once)]
Sample Preparation and Cuvette Selection in Ultraviolet Visible Spectroscopy UV Vis
Spectroscopic accuracy depends heavily on your sample vessel. The cuvette acts as an optical window; using the incorrect material can distort your data before light even reaches the sample.
Choosing the Right UV Vis Cuvettes: Quartz vs. Optical Glass vs. Disposables
Optical cells come in distinct materials, each governed by its own optical transmission cut-off:
| Cuvette Material | Usable Spectral Range | Typical Applications | Relative Cost |
|---|---|---|---|
| Synthetic Quartz (Fused Silica) | $190text{ nm} – 2500text{ nm}$ | Deep UV, DNA/RNA, aromatic proteins, far-UV metrology | High (€100–€300+) |
| Optical Glass (Borosilicate) | $340text{ nm} – 2000text{ nm}$ | Visible colorimetric assays, metal complexation | Moderate (€20–€50) |
| Polymethylmethacrylate (PMMA) | $300text{ nm} – 900text{ nm}$ | Routine visible assays, student laboratories | Low (Disposable) |
| Polystyrene (PS) | $340text{ nm} – 900text{ nm}$ | Industrial high-throughput screening, enzymatic tests | Very Low (Disposable) |
Never attempt to measure protein absorbances at 280 nm or nucleic acids at 260 nm using standard optical glass or standard plastic UV Vis cuvettes. Borosilicate glass absorbs nearly all UV radiation below 340 nm, saturating the detector and rendering measurements meaningless. For any work in the UV-C and UV-B regions, synthetic fused silica (Suprasil or equivalent) is non-negotiable.
Pro Tip: Always verify the orientation of your cuvettes. Quartz cuvettes have two polished optical faces and two frosted handling faces. Mark your cells to ensure the same polished window always faces the incident beam; minor variations in glass thickness between opposite walls can introduce up to 1% baseline offset.
Path Length Considerations and Solvent Cut-Off Limits
While 10 mm path length rectangular cells represent the global laboratory default, path length selection should adapt to your analyte concentration:
- Micro-pathlength cells (0.1 mm to 2.0 mm): Indispensable for concentrated solutions, eliminating the pipetting errors and dilution artifacts common with high-concentration biologics.
- Long-pathlength cells (50 mm to 100 mm): Used in environmental water testing (e.g., trace iron, drinking water colorimetry) where analyte concentration is exceptionally dilute.
Equally important is the solvent UV cut-off—the wavelength below which the pure solvent absorbs more than 1.0 AU against air:
- Water: $190text{ nm}$
- Acetonitrile: $190text{ nm}$
- Methanol: $205text{ nm}$
- Dichloromethane: $233text{ nm}$
- Acetone: $330text{ nm}$
- Dimethylsulfoxide (DMSO): $265text{ nm}$
Using acetone as a carrier solvent for peptide analysis at 214 nm is impossible because the carbonyl group of acetone absorbs all incident photons, blinding the sensor.

Infographic by SiteLift
Mitigating Errors: Stray Light, Refractive Index Matching, and Sample Turbidity
Three physical artifacts frequently plague UV-Vis experiments:
- Stray Light: Wavelengths falling outside the nominal bandpass window that leak onto the detector. Stray light compresses measured absorbance peaks, making high-absorbance samples appear systematically lower in concentration than they actually are.
- Refractive Index Mismatches: If the blank solvent and the sample matrix possess substantially different refractive indices, refraction alters the beam geometry inside the sample compartment. This can cause light to clip the exit slit aperture, mimicking genuine chemical absorption.
- Turbidity and Tyndall Scattering: Suspended particulates, colloidal nanoparticles, or precipitated proteins scatter light out of the optical path via Rayleigh and Mie scattering. The spectrophotometer cannot distinguish between scattered photons and absorbed photons, reporting elevated false absorbance baselines. For scattering samples, use integrating spheres or specialised UV radiometers such as the BTS2048-UV light meter equipped with entrance diffusors.
Where Is UV Vis Spectroscopy Applied Across Dutch Research and Industry?
According to Eurostat, the Netherlands consistently allocates over 2.2% of its GDP to research and development. This sustained investment fuels high instrumentation standards across regional innovation ecosystems, where UV Vis is applied in diverse settings.
Life Sciences and Pharma: Nucleic Acid and Protein Quantification
At the Leiden Bio Science Park and across university medical centers (such as Erasmus MC and UMC Utrecht), UV Vis spectroscopy serves as a frontline purity check for biologics:
- A260/A280 Ratio: Pure double-stranded DNA demonstrates an absorbance ratio at 260 nm versus 280 nm of ~1.8; pure RNA yields a ratio of ~2.0. Ratios falling significantly lower signal residual phenol, protein, or aromatic reagent contamination.
- Direct Protein Quantification (280 nm): Direct quantification relies on the molar absorptivity of aromatic amino acids—primarily tryptophan ($varepsilon approx 5500text{ M}^{-1}text{cm}^{-1}$) and tyrosine ($varepsilon approx 1400text{ M}^{-1}text{cm}^{-1}$). When protein sequences are known, concentration can be determined without standard curves.
- Colorimetric Assays (BCA, Bradford, Lowry): In complex cellular lysates where direct UV absorption suffers from nucleic acid interference, dye-binding assays shifting absorbance into the visible spectrum (e.g., Coomassie Brilliant Blue G-250 shifting to 595 nm in Bradford assays) remain standard.
Agrifood and Environmental Testing: Nitrate, Phosphate, and Water Quality
Surrounded by intensive horticulture in the Westland and major research hubs like Wageningen University & Research (WUR), Dutch environmental testing labs process high daily sample volumes:
- Nitrate ($NO_3^-$) and Nitrite ($NO_2^-$) Monitoring: Direct UV absorbance at 220 nm with baseline subtraction at 275 nm facilitates rapid nitrate tracking in greenhouse discharge waters.
- Molybdenum Blue Phosphate Assays: Orthophosphate reacts with ammonium molybdate and potassium antimonyl tartrate in acidic conditions to form phosphomolybdic acid, which is reduced by ascorbic acid to yield an intense blue complex measured between 880 nm and 712 nm.
- Chemical Oxygen Demand (COD): Colorimetric digestion using potassium dichromate measures organic industrial pollutant loads according to strict Dutch NEN and European water framework directives.
Advanced Materials and Thin-Film Characterization in High-Tech Hubs
In Brainport Eindhoven, home to world leaders in lithography and optical equipment manufacturing, UV Vis spectroscopy steps out of the wet lab and into thin-film material metrology:
- Bandgap Determination via Tauc Plots: By plotting $(alpha hnu)^{1/n}$ against photon energy ($hnu$), semiconductor researchers derive direct and indirect optical bandgaps for novel photovoltaic perovskites, quantum dots, and transparent conductive oxides (TCOs).
- Anti-Reflective Coating Characterization: Specular and diffuse reflectance accessories mounted inside UV-Vis-NIR spectrophotometers measure destructive interference minimums across optical components, verifying deposition thickness within sub-nanometer tolerances.
How Can Dutch Laboratories Ensure Measurement Accuracy and Regulatory Compliance?
Operating within GMP, GLP, or ISO/IEC 17025 accredited facilities requires routine, auditable system suitability testing. You cannot assume your instrument remains calibrated simply because it completed its power-on self-test.
Wavelength and Photometric Verification Standards (NIST and European Pharmacopoeia)
To meet the stringent guidelines set out by the European Directorate for the Quality of Medicines & HealthCare under European Pharmacopoeia (Ph. Eur.) Chapter 2.2.25, Dutch pharmaceutical laboratories must routinely qualify their equipment using traceable standard reference materials:
- Wavelength Accuracy: Data from the National Institute of Standards and Technology (NIST) indicates that holmium oxide solution standard reference materials offer intrinsic wavelength calibration peaks certified to an uncertainty within $pm0.1text{ nm}$. Liquid holmium perchlorate solutions or holmium/didymium doped glass filters provide sharp, atomic-like absorption bands spanning 240 to 650 nm.
- Photometric Accuracy and Linearity: Standard solutions of potassium dichromate ($K_2Cr_2O_7$) dissolved in dilute perchloric acid are evaluated at 235, 257, 313, and 350 nm. According to the European Pharmacopoeia (Ph. Eur. 2.2.25), photometric linearity for UV-Vis spectrophotometers must be maintained within a maximum absorbance tolerance of $pm0.010$ or $pm1%$ depending on the filter standards used.
- Stray Light Testing: Evaluated using sharp cut-off aqueous filters—such as potassium chloride ($KCl$) for 198–200 nm, sodium iodide ($NaI$) for 220 nm, or sodium nitrite ($NaNO_2$) for 340 nm. These solutions absorb essentially 100% of incident radiation at specific bands; any transmission recorded by the photodetector constitutes pure optical stray light.
Standard Calibration Workflow (Ph. Eur. 2.2.25):
[Holmium Oxide Filter]      --> Verify Wavelength Accuracy (±1 nm UV / ±2 nm Vis)
[Potassium Dichromate]      --> Verify Photometric Linearity (±0.010 AU or ±1%)
[KCl / NaI / NaNO₂ Filters] --> Verify Stray Light Ceiling (T < 0.05% / A > 2.5)
Routine Preventive Maintenance and Baseline Calibration Workflows
To prevent unplanned downtime and safeguard data integrity, implement this baseline verification routine:
- Lamp Warm-Up: Deuterium lamps require at least 20 to 30 minutes to achieve thermal equilibrium. Measuring during lamp warm-up results in negative baseline drifting.
- Dark Current Baseline: Run a zero-transmittance calibration (blocking the beam) to cancel ambient light leaks and detector thermal dark currents.
- Air Blank Baseline: Scan an empty sample compartment over your operational wavelength spectrum. The baseline should sit flat at zero absorbance ($pm0.001text{ AU}$). Significant ripples indicate mirror degradation, dust on optical windows, or optical misalignment.
- Cuvette Matched-Pair Validation: Fill both sample and reference cuvettes with high-purity milli-Q water. Scan the pair across your operating window. The absorbance difference should never exceed $pm0.002text{ AU}$.
Key Takeaways: Mastering UV Vis Spectroscopy in the Lab
| Parameter / Factor | Critical Guideline | Common Pitfall |
|---|---|---|
| Spectral Region | UV: 190–380 nm; Visible: 380–780 nm; NIR: 780–1100 nm | Using single light source units across full spectrum |
| Cuvette Material | Synthetic quartz for $<340text{ nm}$; optical glass for $>340text{ nm}$ | Attempting UV protein quantification in disposable plastic or optical glass |
| Absorbance Range | Target linear window: $0.1$ to $1.2text{ AU}$ | Working above $2.0text{ AU}$ where stray light flattens the Beer-Lambert response |
| Optical Configuration | Scanning double-beam for stability; PDA/CCD for speed | Using single-beam setups for multi-hour kinetic experiments without re-blanking |
| Regulatory Metrology | Calibrate with holmium oxide and potassium dichromate | Skipping annual qualification per Ph. Eur. 2.2.25 and ISO 17025 protocols |
Why Modern Optical Metrology Is Still Underrated: An Industry Perspective
Over four decades of distributing advanced photonics across the Benelux region have shown us that laboratories frequently over-engineer their problems. When an analytical assay fails or yields erratic baselines, the typical response is to suspect complex chemical degradation, sample cross-contamination, or reagent batch variation.
In our experience, the culprit is almost always optical.
Operators often overlook the fact that high-grade optical instruments are sensitive physical systems. Scratched cuvette windows, expired deuterium light sources operating at a fraction of their rated flux, uncalibrated slit widths, and overlooked solvent cut-off thresholds cause far more failed runs than bad chemistry.
Selecting the proper instrument architecture—whether that means a rugged scanning double-beam system for regulatory release testing or an ultra-compact array spectrometer like the SilverBullet Compact OEM UV-Vis Spectrometer for real-time production line integration—saves months of troubleshooting down the line. Treating optical metrology with the exact same precision you apply to your biochemistry or materials synthesis is what turns good research into reproducible, world-class science.
— tlsbv.nl
Frequently Asked Questions
What is the difference between a single-beam and a double-beam UV Vis spectrophotometer?
A single-beam spectrophotometer passes light along one optical path through the sample to the detector, requiring manual reference measurements (“blanking”) before running unknowns. A double-beam spectrophotometer continuously splits the light into two distinct paths: one passing through the sample and the other through a solvent reference. This dual-path design corrects for light source fluctuations, thermal drift, and ambient changes in real time, delivering superior baseline stability for long-term or high-precision assays.
Why can standard glass or plastic cuvettes not be used for measurements below 340 nm?
Standard optical glass (such as borosilicate) and everyday plastics (such as polystyrene) strongly absorb electromagnetic radiation in the ultraviolet spectrum below 340 nm. If placed in the optical path during a UV measurement (such as nucleic acids at 260 nm or proteins at 280 nm), the cuvette walls absorb virtually all incident photons. This blocks light from reaching the detector and yields false, off-scale absorbance values. Synthetic quartz (fused silica) must be used for deep UV measurements because it remains optically transparent down to approximately 190 nm.
What causes deviations from the Beer-Lambert law during absorbance measurement?
Deviations stem from both chemical and physical phenomena:
- Chemical factors: At concentrations typically exceeding 0.01 M, molecular electrostatic interactions alter charge distributions and molar absorptivity. Dissociation, dimerization, or acid-base equilibria can also alter the chemical form of the analyte.
- Physical factors: Stray light leaking from the monochromator artificially limits maximum readable absorbance, bending calibration curves downwards. High sample turbidity or light scattering also generates false absorption readings that violate the law’s assumption of a clear, non-scattering medium.
How does European Pharmacopoeia (Ph. Eur.) compliance affect UV Vis calibration in Dutch labs?
Under Ph. Eur. Chapter 2.2.25, regulated pharmaceutical and contract manufacturing laboratories in the Netherlands must certify their instruments against strict metrological limits. This requires documenting wavelength accuracy (typically using certified liquid holmium oxide standards), confirming photometric linearity across target absorbance bands (using potassium dichromate solutions), determining stray light limits with sharp cut-off chemical filters, and verifying spectral resolution. These checks must be performed on defined schedules and documented for GMP/GLP compliance.
What is the operational difference between a scanning monochromator instrument and a photodiode array (PDA) spectrophotometer?
A scanning monochromator instrument illuminates the sample with one monochromatic wavelength at a time, mechanically rotating a diffraction grating to step through the spectrum. This provides high spectral resolution and low stray light, but scanning takes several seconds to minutes.
A photodiode array (PDA) or CCD instrument passes broad white light through the sample first, then disperses the transmitted light across an array of hundreds or thousands of photodetector pixels. This allows the instrument to capture an entire 190–1100 nm spectrum simultaneously in milliseconds, making it ideal for kinetic reactions, chromatography detection, and dynamic process monitoring.