
Raman Instrument Buyer’s Guide: Choosing Systems for Dutch Research Labs
Selecting the right raman instrument for an academic laboratory or industrial R&D facility is rarely straightforward. Whether you are outfitting a cleanroom in Brainport Eindhoven, running an advanced materials group at TU Delft, or setting up a bio-imaging pipeline at Leiden Bio Science Park, your analytical demands are unforgiving. Raman spectroscopy delivers label-free, non-destructive chemical fingerprinting with zero sample preparation, but picking the wrong optical layout, detector technology, or excitation line will quickly lead to compromised data or prohibitive laser-induced fluorescence.
According to market analysis from Grand View Research, the global Raman spectroscopy market reached USD 1.5 billion in 2023 and is projected to expand at a compound annual growth rate (CAGR) exceeding 7% through 2030. This growth is heavily driven by advancements in solid-state lasers, high-throughput transmission spectrographs, and multi-user facility requirements. To make an investment that remains relevant across multi-year grant cycles, lab managers must evaluate hardware far beyond standard vendor datasheets. This guide unpacks the optical, mechanical, and operational criteria essential for selecting a high-performance system tailored to the Dutch research ecosystem.
What Is a Raman Instrument and How Does It Fit Modern Lab Applications?
At its core, a Raman spectrometer measures the inelastic scattering of monochromatic light—an effect discovered by C.V. Raman in 1928. When photons strike a sample, approximately one in ten million scatters inelastically (Raman scatter), gaining or losing energy equivalent to the vibrational transitions of the chemical bonds within the target molecule.
Incoming Laser Photon (hν₀)
           │
           ▼
   [Sample Molecule] ── (Polarizability perturbation during vibration)
           │
     ┌─────┴────────────────────────┐
     ▼                              ▼
Elastic (Rayleigh)             Inelastic (Raman)
hν = hν₀                       hν = hν₀ ± hν_vibration
(Filtered out by edge filter)  (Stokes / Anti-Stokes fingerprint)
By plotting the intensity of this inelastically scattered light against the shift in optical frequency (wavenumbers, cm⁻¹), researchers generate a distinct chemical signature. Because physical bonds correlate directly with vibrational frequencies, the technique identifies polymorphs, tracks crystal lattice strain, distinguishes chemical isotopes, and measures molecular conformation without consumable reagents.
Core Operating Principles of a Raman Spectrometer System
A research-grade Raman spectrometer system integrates five synchronized sub-assemblies:
- Excitation Source: A narrow-linewidth, single-longitudinal-mode (SLM) laser source.
- Delivery and Collection Optics: Optical paths featuring high numerical aperture (NA) objectives or fiber probes to maximize collection efficiency, which scales with $(NA)^4$.
- Rayleigh Rejection Filter: Ultra-steep dielectric edge filters or volume holographic volume phase gratings that attenuate the elastic Rayleigh line by an optical density of OD > 6 to OD > 8, while allowing transmission of weak Stokes signals just tens of wavenumbers from the laser line.
- Dispersive Spectrograph: Czerny-Turner, cross-dispersion, or axial transmissive designs that disperse incoming light spatially across a calibrated focal plane.
- Detector Array: Thermoelectrically cooled or liquid-nitrogen-cooled Charge-Coupled Devices (CCD), Electron-Multiplying CCDs (EMCCD), or Indium Gallium Arsenide (InGaAs) linear arrays for near-infrared capture.
Modern instruments like the Research Grade (RG) Raman Spectrometer focus on low-frequency cutoffs, capturing acoustic phonons down to 10 cm⁻¹ for lattice dynamics and polymorph differentiation.
Micro-Raman vs. Macro-Raman vs. Portable Configurations
Raman platforms fall into three primary form factors:
- Confocal Micro-Raman Systems: Coupling a high-end research microscope to a spectrograph yields a Raman microscope. By placing a pinhole conjugate to the focal plane, out-of-focus background scatter is rejected, delivering sub-micron spatial resolution ($XY approx 300text{ nm}$, $Z approx 1text{ }mutext{m}$) and true 3D chemical volume mapping.
- Macro-Raman Workstations: Designed for bulk analysis, macro setups use large-spot excitation optics (spot diameters from $50text{ }mutext{m}$ to several millimeters). This prevents laser-induced thermal degradation in heterogeneous specimens, such as pharmaceutical pellets, polymer masterbatches, or catalytic slurries.
- Modular and Portable Spectrometers: Compact instruments, such as the ClearPeak Raman System, bridge laboratory quality and inline industrial process monitoring. They use robust fiber-optic probes to sample reactors, cleanroom chambers, or field specimens where moving the sample to a core lab microscope is impossible.
Key Research Demands Across Dutch Universities and R&D Institutes
The Netherlands harbors one of the densest scientific infrastructures in Europe. In regional clusters like NanoLabNL (spanning TU Delft, University of Twente, and TNO), instrumentation must accommodate diverse workloads: single-layer molybdenum disulfide ($text{MoS}_2$) flakes in the morning, followed by microplastics extracted from North Sea sediments in the afternoon.
Dutch core facilities routinely operate on open-access, multi-user business models. Instrumentation deployed here cannot be an idiosyncratic setup mastered by a single PhD student. It must balance modular flexibility for custom optomechanical rigs with straightforward automated workflows that protect sensitive optics from inexperienced operators.
What Hardware Specifications Matter Most When Choosing a Raman Instrument?
Buying optical metrology equipment requires matching physics-driven specifications to experimental limits. Overlooking detector quantum efficiency or optomechanical stability leads to noisy spectra, thermal drift, and wasted laboratory budgets.
Selecting the Optimal Raman Laser Excitation Wavelength
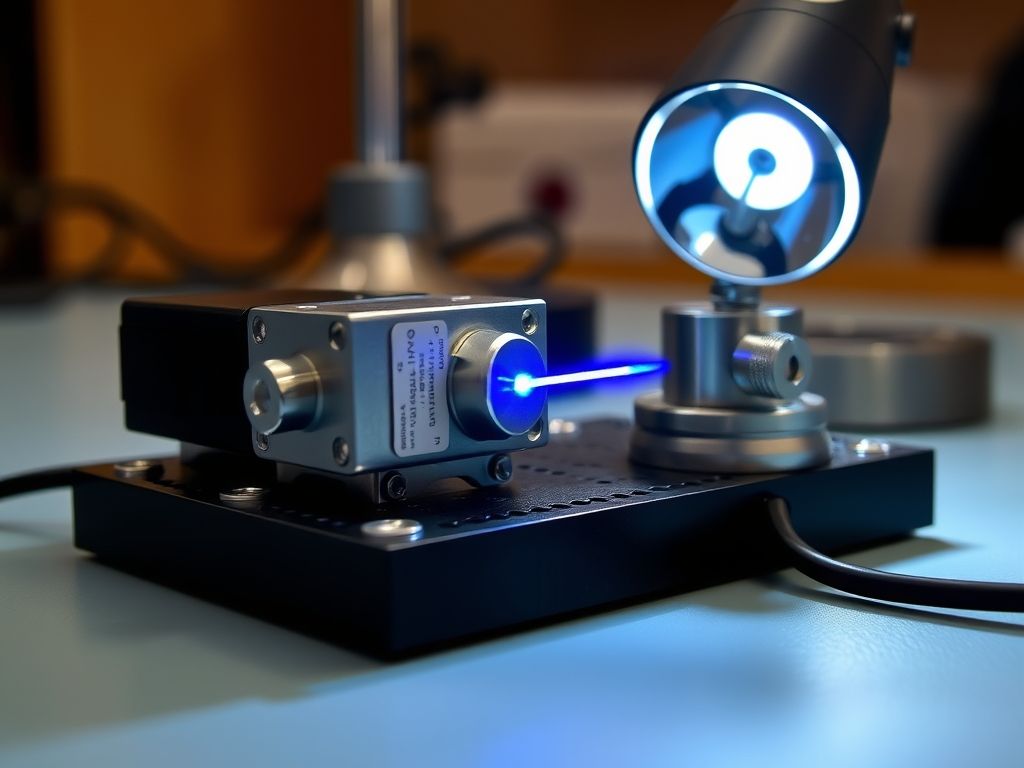
The choice of Raman laser excitation is the most consequential decision in your instrument architecture. The efficiency of Raman scattering is inversely proportional to the fourth power of the excitation wavelength:
$$I_{text{Raman}} propto frac{1}{lambda^4}$$
A 532 nm laser generates roughly 4.8 times more Raman scatter than a 785 nm laser for identical photon flux. However, short wavelengths are far more likely to trigger electronic absorption and dominant autofluorescence in organic, biological, or impure samples.
Wavelength Selection Matrix: Signal vs. Fluorescence
─────────────────────────────────────────────────────────────────
Wavelength    Scattering Cross-Section    Fluorescence Risk    Primary Lab Applications
─────────────────────────────────────────────────────────────────
532 nm        High (~4.8x of 785 nm)      High                 Graphene, carbon nanotubes, inorganics, catalysts
633 nm / 638 nm Intermediate              Moderate             Porphyrins, advanced polymers, SERS
785 nm        Low                         Low                  General biology, cells, polymers, standard organics
1064 nm       Extremely Low (~0.06x of 532) Very Low           Dark polymers, raw plant tissue, crude oils
─────────────────────────────────────────────────────────────────
For biological specimens, bio-fluids, or heavily pigmented matrices, opting for near-infrared platforms like the TPIR-785 provides the ideal compromise between minimizing fluorescence and maintaining adequate detector sensitivity on standard silicon-based CCDs.
Spectrograph Architecture, Gratings, and Detector Technologies
The spectrograph transforms collected photons into actionable spectral lines. Its performance relies on three core parameters:
- Focal Length: Spectrographs with longer focal lengths (e.g., 300 mm to 500 mm) yield superior spectral dispersion, resolving closely spaced peaks (such as crystalline splits in polymer backbones). Shorter focal lengths (e.g., 50 mm to 100 mm) prioritize photon throughput and compactness.
- Diffraction Gratings: Ruling density determines the spectral resolution and the instantaneous spectral window. A 300 lines/mm grating offers a broad overview from 100 cm⁻¹ to 4000 cm⁻¹ in a single acquisition, while an 1800 lines/mm or 2400 lines/mm grating zooms in on fine splitting, though requiring multiple grating angles (stepped stitching) to cover the full spectrum.
- Detector Architecture: Back-illuminated, deep-depletion CCD arrays cooled thermoelectrically to $-70^circtext{C}$ or $-90^circtext{C}$ remain the industry benchmark for visible and 785 nm excitation, suppressing dark current below $0.001text{ e}^-/text{pixel/second}$. When operating at 1064 nm, silicon detectors lose quantum efficiency entirely, requiring linear InGaAs arrays that run hotter and exhibit higher dark counts, necessitating precise software background correction.
Spatial and Spectral Resolution Limits in Confocal Systems
True confocal performance is defined by the system’s ability to isolate scatter from a microscopic volume element (voxel). According to peer-reviewed optical benchmark models published in Optica, the theoretical diffraction-limited lateral resolution ($d_{xy}$) and axial resolution ($d_z$) are governed by:
$$d_{xy} = frac{0.61 lambda}{NA}$$
$$d_z = frac{1.4 lambda cdot n}{(NA)^2}$$
Where $lambda$ is laser wavelength, $NA$ is the numerical aperture of the objective lens, and $n$ is the refractive index of the immersion medium.
Pro Tip: Never accept a vendor’s “software-enhanced” resolution claims at face value. Demand proof of physical confocality using a true optical pinhole or precisely matched slit-confocal architecture. Test this on-site by taking a vertical (Z-axis) depth scan across a thin silicon-oxide-silicon wafer sandwich.
Why Are Raman Instrument Calibration and Spectral Stability Critical?
A raman instrument that drifts by just $2text{ cm}^{-1}$ over a four-hour run can invalidate entire chemometric classification models, misidentify polymorphic drug phase changes, and hide mechanical strain states in epitaxial semiconductor layers.
Managing Laser Wavelength Drift and Baseline Calibration
Diode lasers are susceptible to thermal drift. Even high-end distributed Bragg reflector (DBR) or volume holographic grating (VHG) stabilized diodes will drift if ambient laboratory temperatures fluctuate.
In shared academic environments where cleanroom HVAC systems cycle between day and night loads, optomechanical mounts expand and contract. This shifts both the incident laser line and the spectrograph’s grating angle. High-end systems combat this by integrating internal neon, argon, or mercury-cadmium calibration lamps that run automated validation scripts prior to every data collection cycle.
Standard Reference Materials: Silicon 520.7 cm⁻¹ and Beyond
To ensure day-to-day and lab-to-lab comparability, rigorous Raman instrument calibration protocols rely on consensus standards. While single-crystal silicon is universally used for zero-order shift calibration, broader standards govern systematic operations:
- ASTM E1840 Standard Guide: Defines Raman shift standards for spectrometer calibration, using liquid compounds like cyclohexane, polystyrene, toluene, and 4-acetamidophenol across the whole fingerprint range.
- The Silicon First-Order Optical Phonon Mode: Silicon exhibits a sharp, distinct Raman band at $520.7text{ cm}^{-1}$. Metrological guidelines from the National Institute of Standards and Technology establish that this peak position must be maintained within $pm0.5text{ cm}^{-1}$ for reliable cross-laboratory comparison.
Calibration Routine:
  [Turn-on Stabilization] -> (Wait 30 min for Laser/Detector TEC Lock)
          │
  [Zero-Point Check]      -> Align unshifted Rayleigh scatter or laser cut-off
          │
  [Silicon Verification]  -> Scan Si(100) reference target
          │                 └─ Confirm peak center: 520.7 cm⁻¹ ± 0.5 cm⁻¹
          │                 └─ Verify FWHM: < 3.5 cm⁻¹ (system dependent)
          ▼
  [Intensity Calibration] -> Calibrated white-light tungsten halogen source
                            └─ Corrects for instrument response function (IRF)
Maintaining Reproducibility in Multi-User Academic Core Facilities
In multi-user consortia, system drift often traces back to user intervention—rough objective swaps, dirty optical windows, or misaligned fiber connectors. Modern multi-user instruments should include automated self-checks.
Systems equipped with motorized, software-controlled switching between laser paths minimize internal contamination and eliminate the mirror-tilt errors common when manually realigning optical paths.
How Do Primary Dutch Research Applications Dictate Raman Specifications?
Dutch technological infrastructure revolves around high-density regional clusters. Each hub presents distinct material challenges that directly dictate the optomechanical design of your Raman setup.
Semiconductor, Graphene, and Nanotechnology (Brainport and Enschede)
The Brainport Eindhoven corridor (anchored by ASML, Philips, and TU Eindhoven) alongside MESA+ at the University of Twente drives high-precision nano-electronics research.
Characterizing strain in thin silicon fins, inspecting 2D transition metal dichalcogenides ($text{TMDs}$ such as $text{WS}_2$, $text{MoS}_2$), and quantifying defects in chemical vapor deposition (CVD) graphene require:
- High-density gratings (1800 or 2400 lines/mm) to resolve the graphene D ($1350text{ cm}^{-1}$), G ($1580text{ cm}^{-1}$), and 2D ($2690text{ cm}^{-1}$) bands.
- High-precision piezo stages with sub-nanometer step resolution to perform fast 2D mapping without optical blur.
- Low-power laser attenuation (down to micro-watts) via software-controlled neutral density (ND) filter wheels to prevent local sample ablation or thermal expansion shifts during measurement.
For laboratories working with tight footprint constraints in cleanrooms, deploying compact solutions like the modular Raman microscope preserves valuable workspace while delivering true confocal mapping.
Life Sciences, Bio-Optics, and Organ-on-Chip (Leiden and Utrecht)
At the Leiden Bio Science Park and Utrecht Science Park, Raman applications focus on non-invasive cell classification, drug-delivery tracking in liposomes, and extracellular vesicle analysis.
- Aqueous Environments: Water is a exceptionally weak Raman scatterer (unlike its strong infrared absorption), making Raman ideal for hydrated biological systems. However, high-NA water-immersion objectives ($NA ge 1.0$) are necessary to eliminate spherical aberrations at the glass-water interface.
- Laser Damage Mitigation: Living mammalian cells rapidly undergo photo-damage when exposed to high-density green radiation. Excitation at 785 nm balances low autofluorescence with cell viability.
Polymers, Sustainable Chemistry, and Catalysis (Groningen and Wageningen)
The Northern Netherlands (University of Groningen) and Wageningen University & Research (WUR) lead circular chemistry, bio-based polymers, and heterogeneous catalysis research.
- Operando Reaction Chambers: Catalysis monitoring requires coupling Raman fiber probes directly into high-pressure, high-temperature catalytic batch reactors (Parr reactors) or microfluidic capillaries.
- Fluorescence Rejection in Bio-Polymers: Bio-based plastics derived from agricultural feedstocks frequently retain trace lignins, pigments, or degradation components that fluoresce heavily under visible light. Here, 785 nm or 1064 nm excitation combined with Shifted Excitation Raman Difference Spectroscopy (SERDS) is essential to subtract persistent fluorescence backgrounds.
Key Takeaways: Evaluating Your Raman System
Before moving forward with budget requests and grant proposals, use this comparison matrix to assess how different Raman architectures align with your group’s primary applications:
| Feature / Architecture | Modular Benchtop Spectrometer | Confocal Raman Microscope | High-Throughput Macro System | Portable Inline Raman Probe |
|---|---|---|---|---|
| Primary Dutch Research Fit | Physics / Chemistry Core Labs | Nanotechnology, 2D Materials, Cleanrooms | Bulk Catalysis, Agrotechnology, Polymers | Pilot Plants, Process Chemistry, In-situ monitoring |
| Spatial Resolution | Fiber-limited ($>50text{ }mutext{m}$) | Diffraction-limited ($<0.5text{ }mutext{m}$) | Large area spot ($0.1 – 2text{ mm}$) | Point probe ($>100text{ }mutext{m}$) |
| Sample Preparation | None | Minimal (flat substrates preferred) | None | In-situ immersion / direct sight |
| Excitation Flexibility | High (fiber-swappable lasers) | Medium to High (internal beam splitters) | Fixed wavelength | Single integrated wavelength |
| Autofluorescence Risk | Wavelength dependent | Wavelength dependent | Wavelength dependent | Low (typically NIR/1064 nm) |
| Relative Cost Base | Low to Moderate | High to Enterprise | Moderate | Low to Moderate |
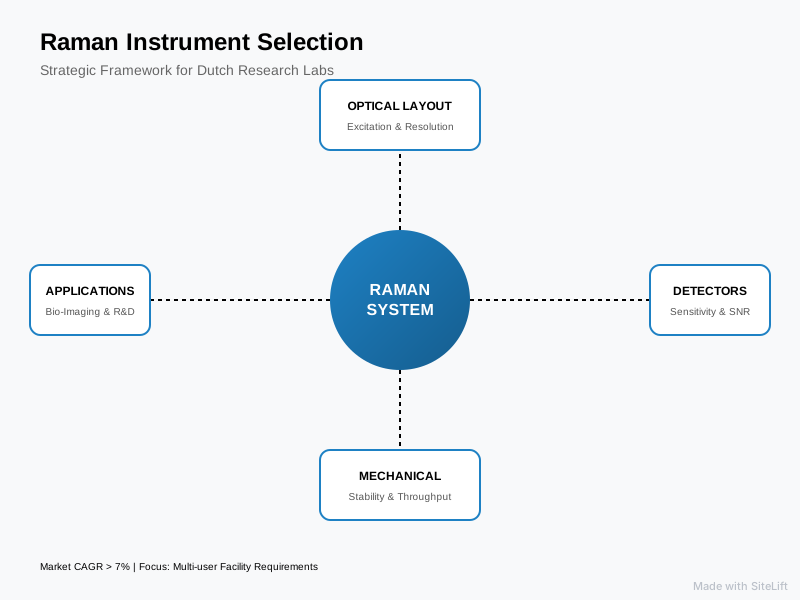
Infographic by SiteLift
Editorial: Why Open-Architecture Optical Systems Outlast Black-Box Instruments
Over the past two decades of assessing analytical instruments across European research laboratories, we have seen a clear, recurring pattern. A department invests €300,000 in a glossy, proprietary, “black-box” Raman system. For the first two years, while the original PhD student who championed the purchase is present, the instrument operates smoothly. But by year four, the team wants to direct an external ultrafast Ti:Sapphire laser into the sample chamber, or integrate an atomic force microscope (AFM) for Tip-Enhanced Raman Spectroscopy (TERS).
Suddenly, they hit a wall. The instrument’s proprietary chassis cannot be bypassed, the software locks out third-party camera drivers, and the vendor demands a five-figure fee just to modify an internal optical path.
We believe closed-architecture Raman systems are fundamentally ill-suited for frontier research.
When you purchase a Raman platform, you are not merely purchasing an analytical balance or a standard pH meter; you are investing in an optomechanical collection platform. Research directions mutate quickly under the influence of new funding cycles and breakthrough discoveries.
Open-architecture and modular fiber-coupled Raman spectrometers provide an escape hatch against instrument obsolescence. When your group pivots from silicon microelectronics to NIR bio-imaging, a modular platform lets you swap a 532 nm laser line and grating turret for a 785 nm laser and an InGaAs array—without binning the entire spectrometer assembly.
Invest in optical access, mechanical stability, standard C-mount and cage system compatibilities, and transparent software APIs. Your lab’s future researchers will thank you.
— tlsbv.nl
What Operational and Procurement Factors Impact Total Cost of Ownership?
Buying scientific hardware involves far more than comparing the initial capital outlay listed on a vendor quotation. Lab managers must forecast the Total Cost of Ownership (TCO) across a typical 7-to-10-year operational life cycle.
Total Cost of Ownership (TCO) Breakdown (10-Year Horizon)
┌────────────────────────────────────────────────────────┐
│ [Initial Hardware Acquisition] ~50-60%                │
├────────────────────────────────────────────────────────┤
│ [Laser Replacements & Diode Degradation] ~15%          │
├────────────────────────────────────────────────────────┤
│ [Software Licensing & Maintenance Contracts] ~15%      │
├────────────────────────────────────────────────────────┤
│ [Recalibration, Service Calls, Down-Time] ~10-15%     │
└────────────────────────────────────────────────────────┘
Turnkey vs. Modular Spectrometer Platforms
A fully integrated turnkey system offers convenience: unbox it, plug in the power and USB cables, complete a half-day operator training session, and begin taking data. This is ideal for regulated industrial environments (such as QC labs at generic pharmaceutical manufacturers) where standard operating procedures (SOPs) mandate fixed, unalterable conditions.
In dynamic academic research, however, modularity wins. If an excitation laser’s diode degrades after 8,000 hours of operation in a turnkey system, the entire microscope often has to be packed into a crate and shipped back to a factory in the UK, Japan, or the United States.
With a modular setup, you isolate the sub-assembly, order a replacement laser head, mount it into standard optical rails, re-align the fiber coupler, and resume experiments within days.
NWO and Horizon Europe Grant Alignment and Scalability
Strategic investments in Dutch academia often rely on funding from the Dutch Research Council (NWO), specifically schemes like the NWO Large-Scale Scientific Infrastructure (NWO-Groot) or Open Technology Program grants.
NWO review committees heavily prioritize projects that prove multi-disciplinary utility and broad institutional access. Grant proposals that outline a modular optical setup—capable of serving cleanroom fabrication teams, chemical catalysis labs, and biomedical departments alike—routinely score higher on strategic feasibility than proposals requesting narrow, single-purpose hardware.
Pro Tip: When writing an NWO infrastructure proposal, explicitly detail how the instrument’s open mechanical layout allows for future expansion (such as external cryostats, high-temperature environmental cells, or photoluminescence integration). This signals to reviewers that their capital investment will deliver scientific returns beyond a single project timeline.
Local Technical Support, Service Contracts, and Fiber Upgrades
One of the most overlooked aspects of instrument acquisition is geographic proximity to technical support. When an unexpected alignment fault or laser failure hits your lab right before an international project deadline, waiting weeks for a field engineer to fly in from abroad is deeply frustrating.
Partnering with local optical engineering specialists within the Benelux ensures fast access to spare optical components, hands-on laser recalibration, and modular fiber upgrades. A local partner who understands optical engineering can collaborate on custom sample stages, motorized optical pathways, and specialized light collection arrays tailored to your exact experimental geometry.
Partnering with Dutch Photonics Specialists for Raman Integration
Navigating spectrometer configurations, diffraction efficiencies, and fluorescence limits requires deep, practical optical engineering experience. Since 1985, Te Lintelo Systems (TLS) has served as a specialized B2B photonics partner for Dutch universities, research institutes, and high-tech enterprises across the Benelux.
Rather than locking your lab into a rigid catalog product, TLS matches world-leading laser sources, high-precision spectrometers, and modular microscopes directly to your experimental setup. Whether you need a low-frequency Raman spectrometer for crystalline materials, a fiber-optic NIR system for sensitive biological compounds, or custom light metrology assemblies, our team provides the technical consultation, on-site demonstrations, and long-term local support essential to keep your research moving forward.
Planning a system upgrade or preparing an infrastructure grant application? Explore our comprehensive range of Raman spectroscopy systems or reach out directly to our engineering team to arrange an on-site technical consultation.
Frequently Asked Questions
What is the most versatile Raman laser excitation wavelength for a multi-user academic lab?
For a shared academic core lab supporting diverse materials, 532 nm and 785 nm dual-wavelength setups offer the highest versatility. The 532 nm line is ideal for inorganic samples, semiconductors, carbon nanomaterials, and catalysts due to its high Raman scattering efficiency. The 785 nm line serves as the workhorse for organic chemistry, polymers, and biological tissues, suppressing autofluorescence while maintaining good detection sensitivity on standard silicon CCD detectors.
How does a confocal Raman microscope differ from a standard benchtop Raman spectrometer system?
A standard benchtop Raman spectrometer system typically samples a bulk volume (spot sizes from $50text{ }mutext{m}$ to several millimeters) and collects signal throughout the entire depth of the illuminated sample. A confocal Raman microscope incorporates high-magnification microscope objectives and a spatial pinhole (or confocal slit). This setup rejects out-of-focus light, isolating a microscopic sample volume of less than 1 cubic micrometer, enabling sub-micron lateral mapping and depth profiling.
How often does a laboratory Raman instrument require calibration?
For high-precision research labs, a quick zero-point and silicon reference check ($520.7text{ cm}^{-1}$) should be performed daily or at the start of each experimental session. Full spectral recalibration using certified standard materials (such as those outlined in ASTM E1840 standards, including cyclohexane or neon emission lines) should be conducted monthly, or whenever the ambient room temperature shifts significantly, optical fibers are swapped, or internal optical components are modified.
Can a Raman instrument analyze highly fluorescent biological or organic samples?
Yes, but the system must be configured to mitigate fluorescence interference. Common technical strategies include moving to near-infrared Raman laser excitation (such as 785 nm or 1064 nm), employing Shifted Excitation Raman Difference Spectroscopy (SERDS), or leveraging Time-Gated Raman spectroscopy. Time-gating uses picosecond laser pulses and ultrafast detector gating to capture the instantaneous Raman scatter (which occurs within picoseconds) while gating out the slower fluorescence background (which persists for nanoseconds).
What facilities and infrastructure are required to install a high-end Raman system in a research lab?
A research-grade confocal Raman instrument typically requires:
- An optical table or vibration-isolation platform to decouple floor vibrations from the high-NA microscope objectives.
- A temperature-stabilized environment (ideally controlled to $pm1^circtext{C}$) to prevent laser diode drift and grating misalignments.
- Standard 230 V electrical supply with clean grounding to minimize electronic noise on high-sensitivity CCD detectors.
- Proper laser safety controls, including appropriate safety interlocks, room warning indicators, and certified protective eyewear matching your laser excitation wavelengths (Class 3B or Class 4 laser safety regulations).